|
Products /
CELESTIAN / CELESTIAN User Manual
CELESTIAN is software for GNSS data viewing, plotting and analysis.
- CELESTIAN is designed for Windows OS
- Linux users may run Celestian under WINE
- 64-bit OS
- Multi-core CPU 2.4 Hz (and above)
- At least 8 GB RAM
- KernelSAT web account
- Internet link for user logon at startup
|
# Supported formats & protocols
|
|
Up to date version of CELESTIAN may decode and visualize the following formats and messages:
| Format |
Versions / Messages |
| RINEX |
Observables (measurements) of RINEX2, RINEX3, RINEX4 |
| Compact RINEX |
Observables (measurements) of Compact RINEX (Hatanaka Compressed) of versions 1.0 and 3.0 |
| BINEX |
Observables (measurements), only 7F_05 message is supported |
| NMEA |
GGA, VTG, ZDA, HDT, RMC, GSA (partially) |
| RTCM3 |
|
Legacy measurements (RTCM3.1): 1001-1004, 1009-1012
|
|
MSM (RTCM3.2):
1073-1077 (GPS)
1083-1087 (GLONASS)
1093-1097 (GALILEO)
1103-1107 (SBAS)
1113-1117 (QZSS)
1123-1127 (Beidou)
1133-1137 (IRNSS)
|
|
Base Position: 1005, 1006
|
|
Aux: 1007-1008, 1032-1033
|
|
| UBLOX UBX |
NAV-PVT, RXM-RAWX |
Download latest CELESTIAN version for Windows OS. Running on Linux is possible w/ help of WINE.
 |
| Fig. CELESTIAN application icon |
Launch the application. Celestain requires online authentication. KernelSAT web account credentials are to be used.
Please create new account if you do not have it yet.
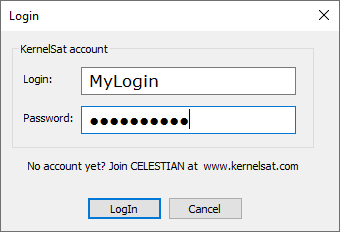 |
| Fig. Authentication window. Please use Kernelsat web account credentials. |
Check the following if auth is failed:
- Login & passwords are correct
- There is Internet connection
- Celestian is not blocked by firewall, antivirus etc
Once auth is done, new project dialog appears. You may always check auth status using main menu Login → Logged as.... .
One may upload up to 6 x GNSS files to be viewed and plotted together.
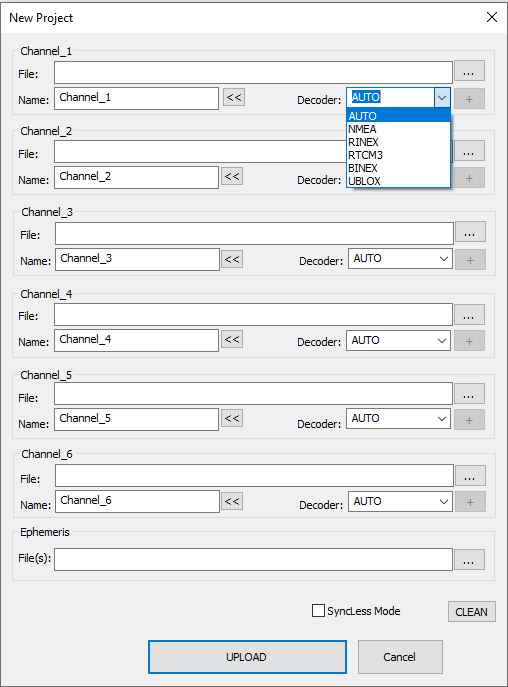 |
| Fig. "New Project" dialog |
FILE: Path to file w/ GNSS data. CELESTIAN doesn't care about file extensions (could be any). Concrete protocol (NMEA, RINEX etc) is detected automatically
(if decoder is set as "AUTO").
NAME: Optional friendly file name, say "My Rover", "Base" or "Receiver_1". Will be used in table & plot legends.
Set channel name equal to file name by "<<" button.
DECODER: Type of decoder to be used. AUTO - data protocol will be detected automatically (the first found protocol
from the file beginning). If the file contains data of multiple types (for instance, UBLOX UBX + NMEA)
and you're interested in concrete one - it make sense to specify if forcibly.
GNSS data files being uploaded into Celestian must be logged somehow in the same time frame (tolerance +/- 1 day).
Say, if first file is logged in June 2021, second - in November 2023 - Celestian will refuse to process and visualize them together.
Refer to 'SyncLess' setting in this case.
SyncLess Mode:
If checked, Celestian ignores epochs time / date from uploaded files. May be useful if there are issues w/ time scale in
uploaded files (time / date jumps) or if uploaded files were collected in so different moments of time preventing them to
be displayed on one plot (different years for instance).
Ephemeris:
Celestian is able to compute satellites orbits using provided RINEX ephemeris file(s). It allows to estimate SVs elevation and azimuth useful for raw
measurements analysis (say plotting SNR or MP1/MP2 combinations as function of elevation).
Celestian is capable of computing orbits for GPS, GLONASS, GALILEO, BEIDOU, QZSS, IRNSS, SBAS.
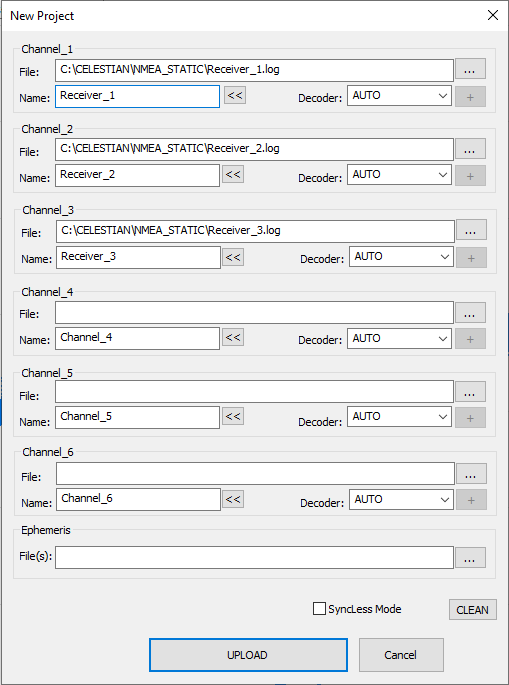 |
| Fig. Uploading 3 x files into Celestian. |
Once file decoding is completed, press "OK" button. Celestian may look like on the picture below:
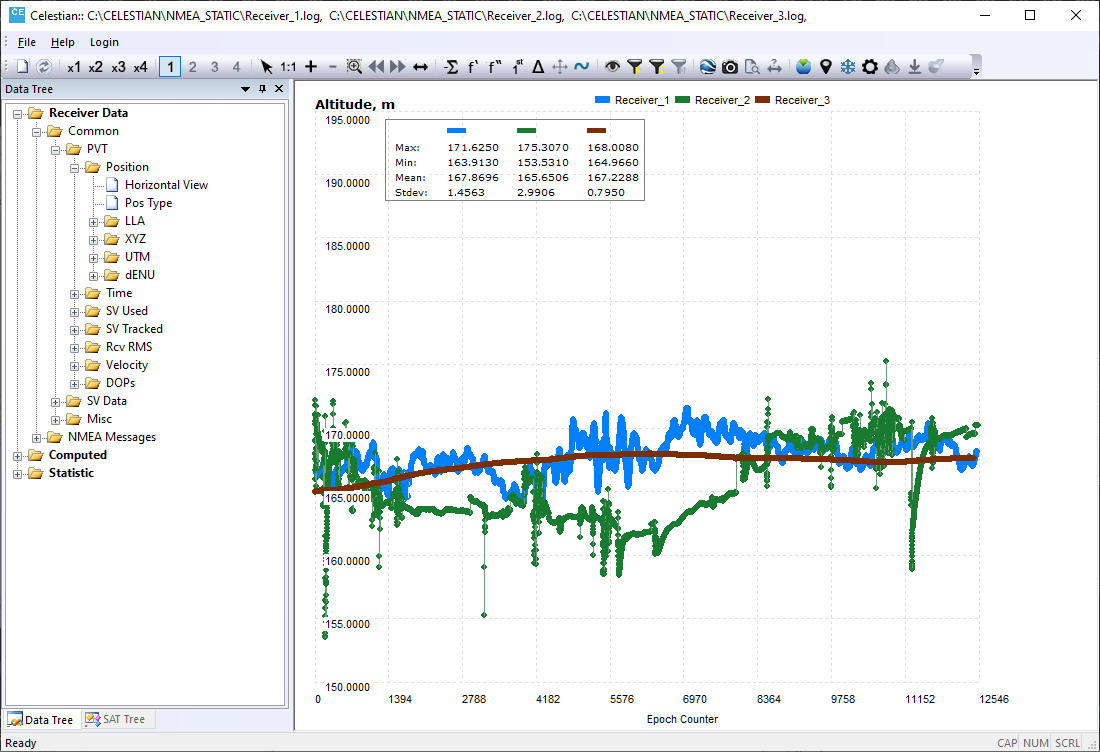 |
| Fig. Celestian main window. |
Toolbar includes different set of instruments and tools widely used when working w/ Celestian. Each tool will be explained in details further.
 |
| Fig. Celestian toolbar. |
Celestian fills DATA Tree w/ information about available data extracted from uploaded files which could be plotted or some statistical information may be displayed.
 |
| Fig. DATA TREE. |
Celestian fills SAT Tree w/ information about available satellites and signals extracted from uploaded files.
 |
| Fig. SAT TREE. |
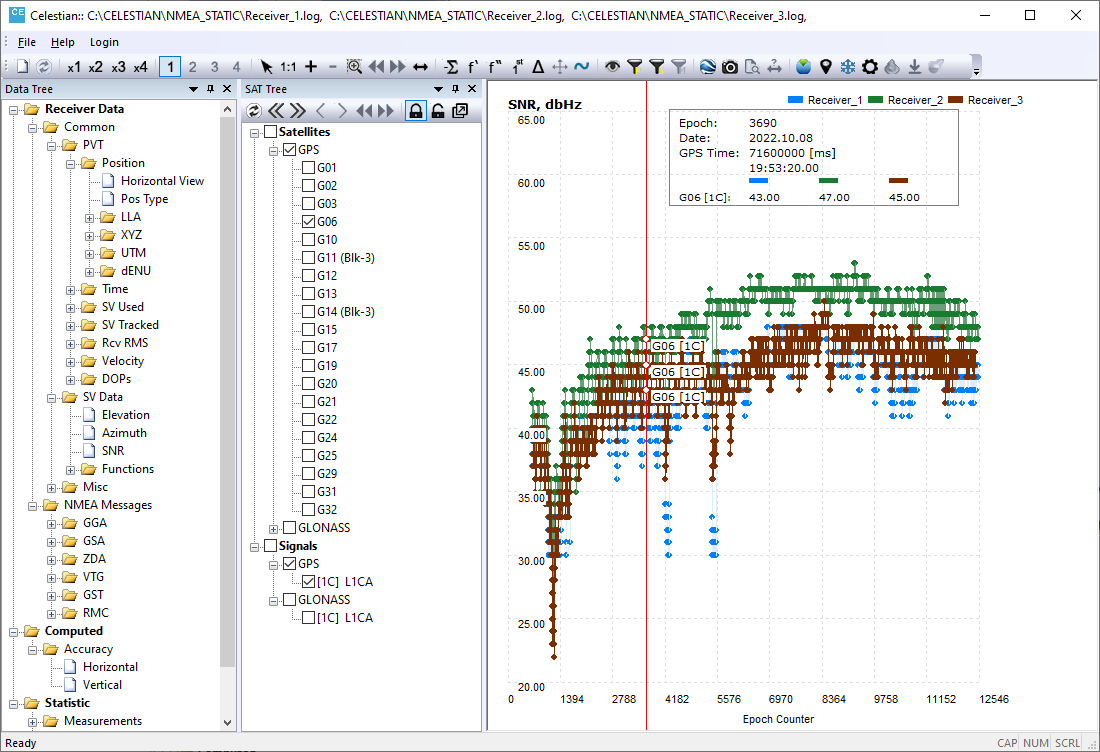
Plots are displayed in Plot area (say Altitude or SNR over time).
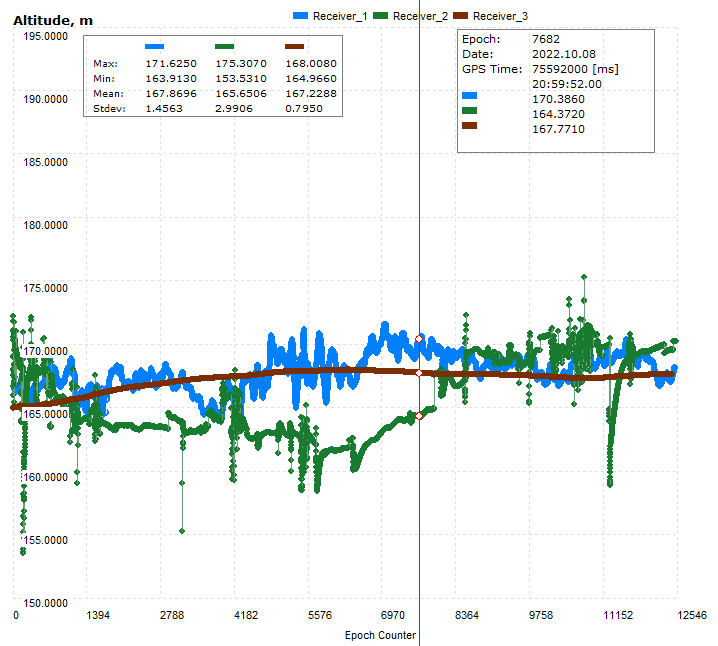 |
| Fig. Plot area. |
DATA, SAT Tree and some other windows / toolbars may be placed in preferred location / form. Just click and hold window title and start moving it.
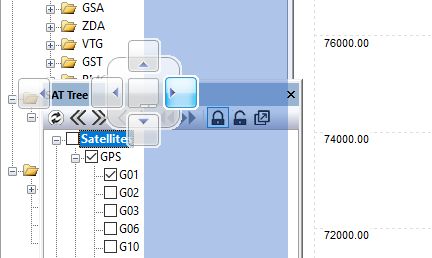 |
| Fig. Windows layout |
Probably, someone may find placing DATA and SAT tree as showed on the picture below more convenient.
 |
| Fig. DATA and SAT Tree showed simultaneously. |
 |
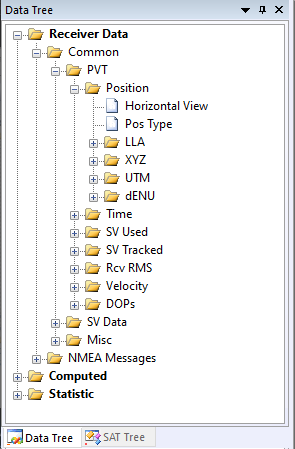
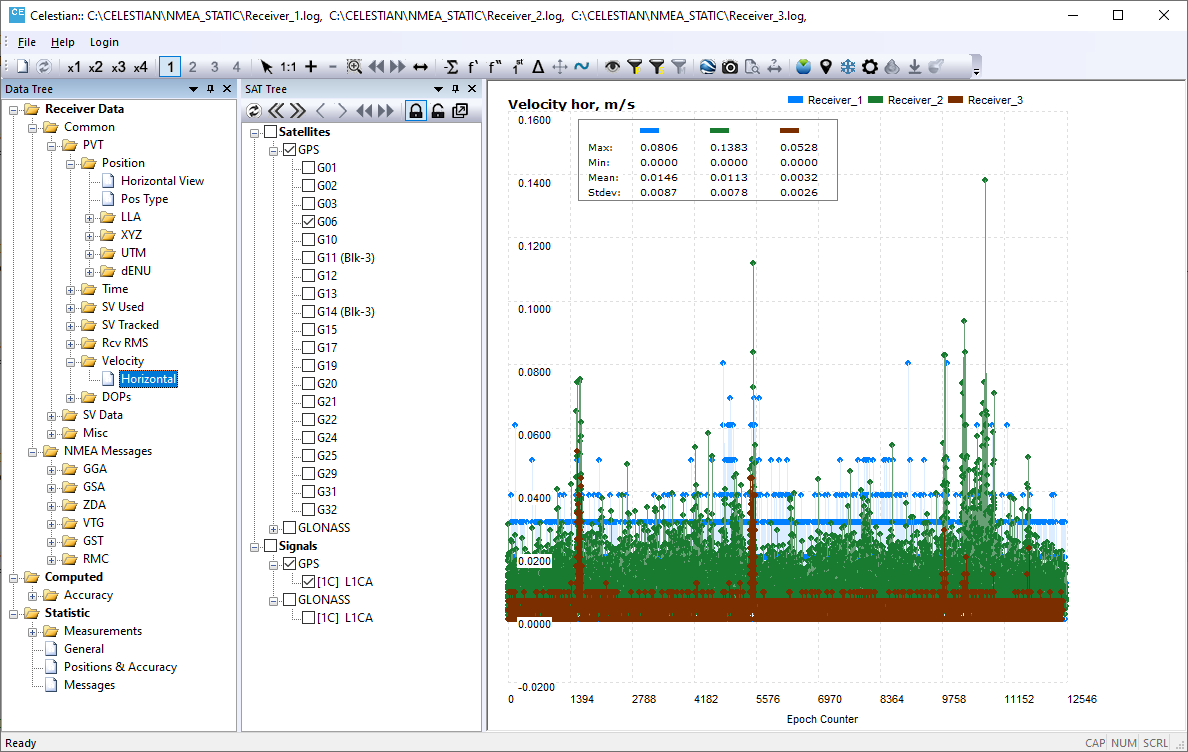
| Fig. DATA Tree in details. |
|
DATA Tree usually includes several main sections:
- Receiver Data (what is extracted from uploaded files)
- Computed (some parameters estimated by Celestian)
- General (statistic and analytics tables)
Receiver Data sub-section usually consists of the following sub-sections:
- Common (data types common for different GNSS formats and protocols)
- Protocol Messages (some of messages may be presented by Celestian in field-by-field view for detailed analysis)
Example of data common among different protocols and GNSS data formats is receiver position, number of tracked and used satellites, SNR etc.
|
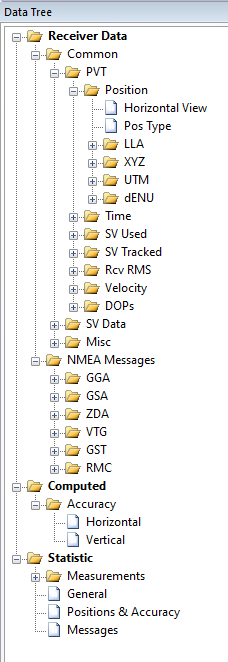
Clicking on available data type allows to plot this sort of data. For instance, Horizontal velocity is drawed on the picture below.
 |
| Fig. Draw data type by clicking it on DATA Tree. |
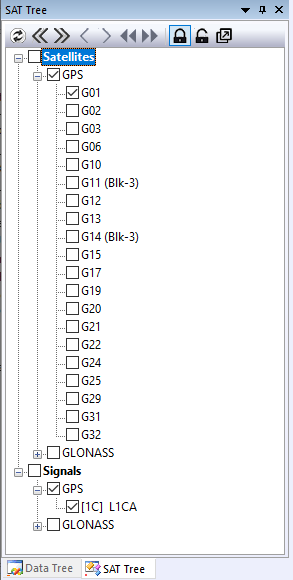
SAT Tree allows to choose concrete satellites and signals to be drawed if data type depends on concrete satellite.
For instance, SNR values. One may want to plot GPS L1CA only or GLONASS R15 SV only. Both SV and Signals are to be specified
for data types which depends on both (say SNR or pseudorange).
|
| Fig. SAT DATA tree. |
Press "Apply" button in order to re-draw plots w/ SV data.
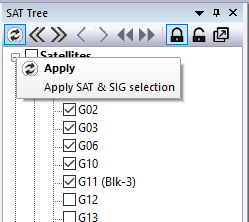 |
| Fig. Apply Satellite and Signal selection to re-draw SVs plots. |
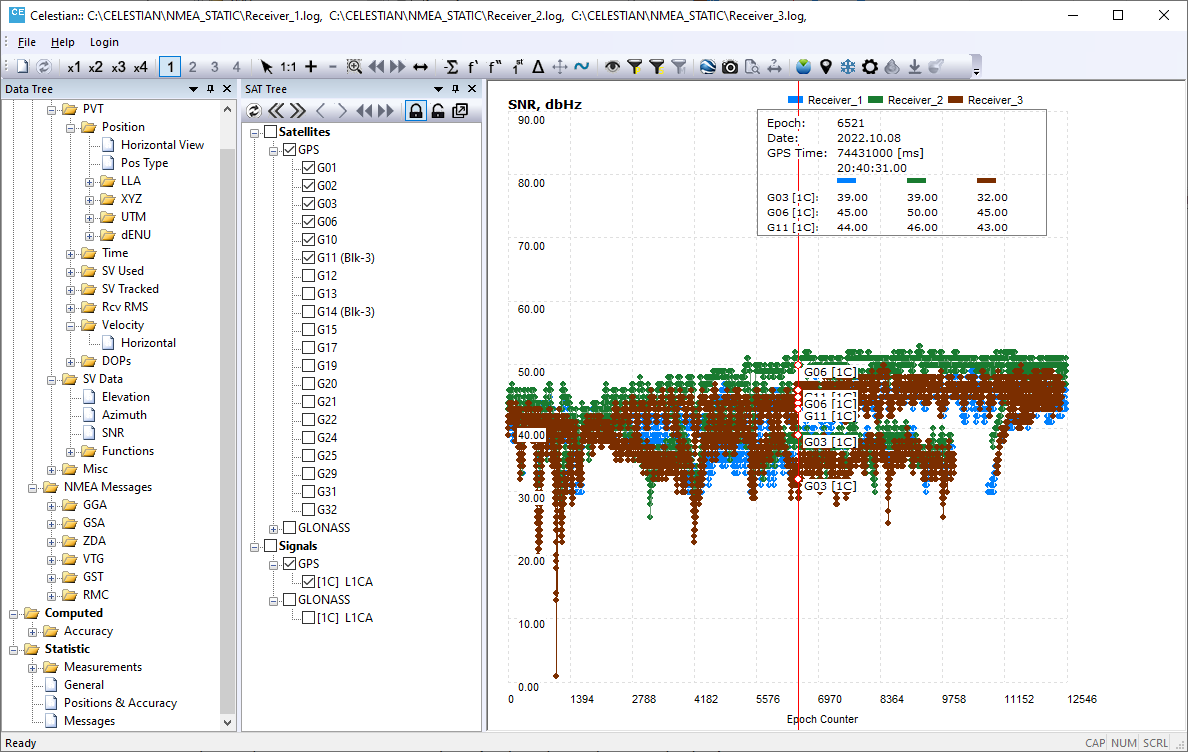 |
| Fig. Several GPS satellites are chosen for SNR plot |
Celestian allows to draw up to 4 x time synchronized plots. Number of independent plots is controlled by ToolBar buttons "x1, x2, x3, x4".
Activated button "1, 2, 3 or 4" inform what plot area is now active (2nd plot on the picture below).
"Active" means this area will be used for drawing if new data type is clicked in DATA Tree.
Multiplot feature allows to analyze several data types simultaneously, say Number of Tracked SVs, their Elevations, Position etc.
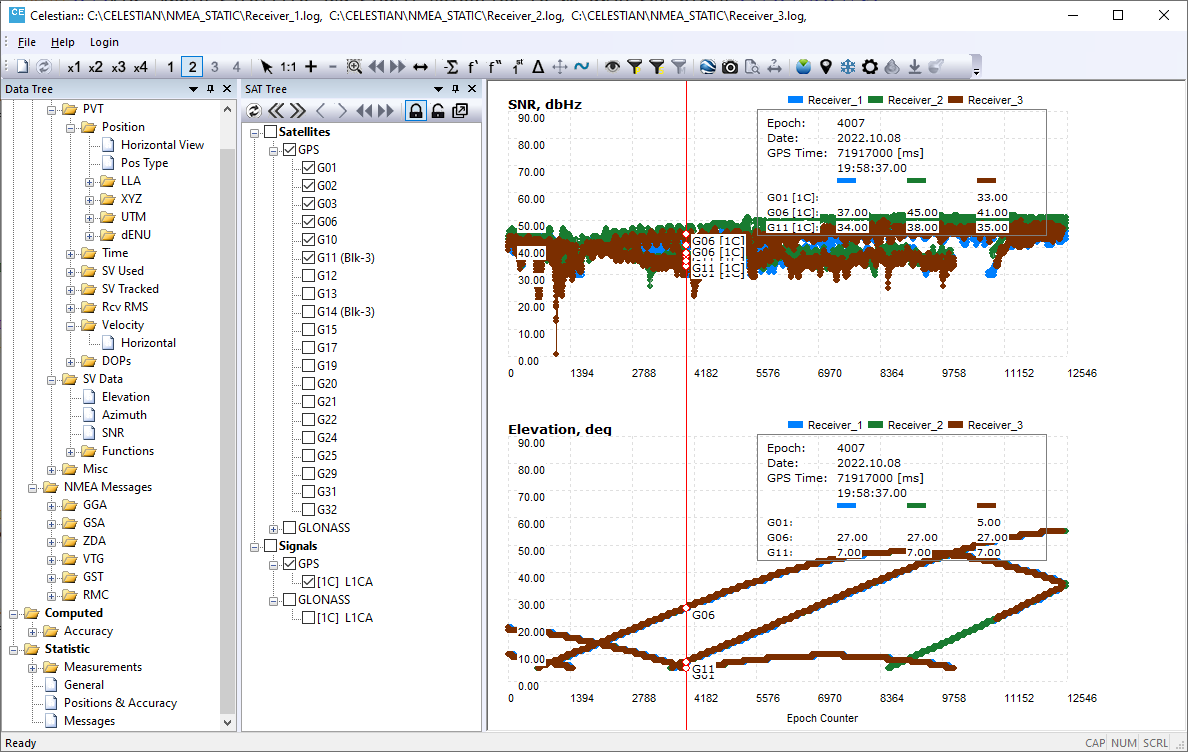 |
| Fig. Two time-syncronized plots displayed simultaneously. |
1:1 Returns zoom to original one
 Zoom in, zoom out around the place where mouse is clicked on the plot. Zooming is done synchroniously for all the sub-plots. Zoom in, zoom out around the place where mouse is clicked on the plot. Zooming is done synchroniously for all the sub-plots.
 Area Zoom - zooming of selected area. Area Zoom - zooming of selected area.
 move left / right when the plot is zoomed in move left / right when the plot is zoomed in
 zoom in using start and stop epoch zoom in using start and stop epoch
|